
 Source: Smarter Balanced Assessment Consortium
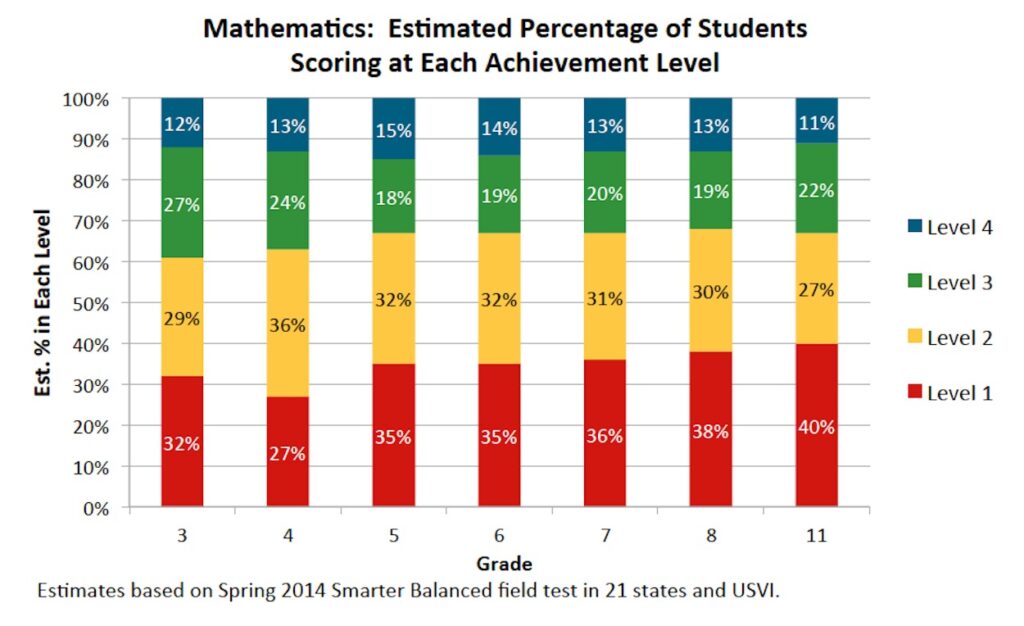 Source: Smarter Balanced Assessment Consortium
Between a third and 44 percent of students in California and 16 other states taking the same test next spring on the Common Core standards are expected to score at grade level in math and reading, according to projections released Monday by the creator of the states’ tests.
For 11th-graders, only 33 percent of students would be on track for college work in math while 41 percent would have reading and English language arts skills necessary for college work by the time they graduated from high school, according to information by the Smarter Balanced Assessment Consortium, an organization of states, including California, that created the tests.
The proficiency projections were derived from the “cut scores” or points establishing four levels of performance on the tests. About 500 teachers, administrators and college faculty, along with some parents and community leaders from the Smarter Balanced states, recommended the performance levels after week-long group discussions, by grade, of how students would demonstrate full or partial knowledge of the Common Core standards. The performance of 4.2 million students on the Smarter Balanced field test last spring was then used to estimate how well students will do on the actual tests in 2015.
Representatives from the 22 member Smarter Balanced states endorsed the recommended cut scores establishing four achievement levels at a meeting in San Diego on Friday night.
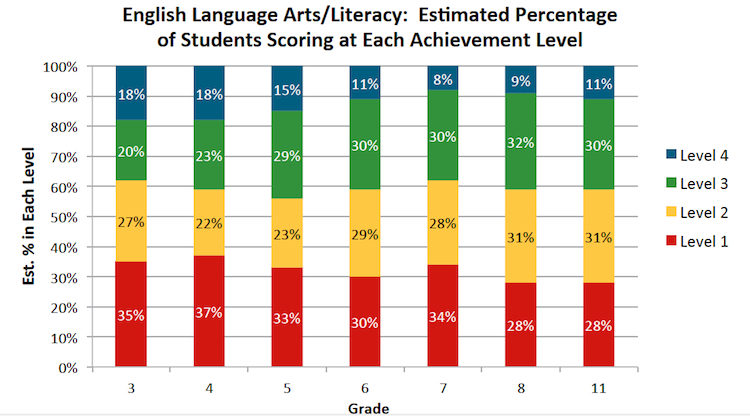
The Smarter Balanced tests will be given to students in grades three through eight and grade 11. The projections of proficiency vary by grade and subject, with 39 percent of third-graders predicted to be at or above grade level in math, compared with 32 percent of eighth-graders. In English language arts, 38 percent of third-graders would be at grade level, compared with 44 percent of fifth-graders.
Source: Smarter Balanced Assessment Consortium
The score at or above Level 3 indicates the percentage of students who would perform at grade level or, for 11th-graders, would be on track to handle college level work without need for remediation, based on the Smarter Balanced test in English language arts.
Scoring at Level 3 is equivalent to proficiency or grade level work; Level 4 designates advanced work. Levels 1 and 2 demonstrate partial or minimal knowledge of the standards.
Consortium and California officials have warned that the initial scores on the Smarter Balanced tests would be lower than on tests based on California’s and most states’ standards, because the Common Core standards are harder, and the tests, designed to measure critical thinking, problem solving and verbal reasoning, will be harder. They reiterated that on Monday while cautioning against comparing results on the California Standards Tests with those of Smarter Balanced.
“Because the new content standards set higher expectations for students and the new tests are designed to assess student performance against those higher standards, the bar has been raised,” Joe Willhoft, executive director of Smarter Balanced, said in a statement. “However, over time the performance of students will improve.”
“Any time you bring in a new exam, especially one that is connected to a fundamental shift in standards, it takes time” to reflect achievement, Richard Zeiger, chief deputy state superintendent of public instruction, said in an interview. “Teachers need time to teach, and students will get better as they progress through grade levels, starting with the youngest students.”
In 2013, the last time that the California standardized tests were given, 51 percent of students overall posted a score of proficient and above in math and 56.4 percent of students scored proficient and above in English language arts. The scores ranged from 46 percent proficient in third grade reading to 72 percent proficient in fourth grade math. However, a decade earlier, scores averaged 35 percent proficient or above in math and reading – about the predicted starting point for Smarter Balanced.
Results on next spring’s Smarter Balanced tests are expected to become the base scores for reviving the state’s Academic Performance Index, or API, which was suspended last year. Actual API scores would be set the following year, in 2015-16, based on the growth from the base scores.
The Smarter Balanced tests will be computer-based, with the state predicting that less than 1 percent of schools will have to give the tests using paper and pencil for lack of technology. However, reflecting wariness over being judged too soon on tests they’ve never taken and standards they’re just beginning to implement, the Association of California School Administrators and the California School Boards Association asked the State Board of Education to put off setting API base scores using the new tests for another year. The board didn’t respond at its meeting last week.
The federal government required that Smarter Balanced and another consortium of states, the Partnership for Assessment of Readiness for College and Careers, or PARCC, to set four levels of cut scores. Under the federal No Child Left Behind law, schools and districts that didn’t attain near-100 percent levels of student proficiency on standardized tests by this year faced sanctions. Most states have gotten waivers from the penalties, but not California.
Downplaying a single test
Critics of Common Core and the new assessments have argued that the new, harder standards are again setting up schools for failure. Teachers in states that require using standardized test scores for teacher evaluations also voiced opposition. California is not one of those states.
California officials, including Gov. Jerry Brown, the state board, most legislators and chancellors of the state’s public universities have praised the new assessments and standards as vital for preparing students for college work and for a more technically demanding workplace. However, they’ve also laid out a vision for a new school accountability system that will give less weight to standardized tests in judging a student’s or a school’s achievement. Student scores are one of eight priorities that districts must measure and address in the Local Control and Accountability Plans they are required to create. Under a new state law, the state board will be required to add additional factors, like graduation rates, into the API, reducing the weight of reading and math scores.
In the press release announcing the cut scores, Smarter Balanced also released a memo warning against an oversimplified use of a single cut score.
“Achievement Levels should not be interpreted as infallible predictors of students’ futures. They must continuously be validated, and should be used only in the context of the multiple sources of information that we have about students and schools,” it said.
The memo offered an alternative way of presenting the results: a vertical scale of scores, starting at 2,000 and ending at about 3,000, that would track students’ performance from third through 11th grades. The cut scores for each grade would be individual points on the scale. But the full scale would show students’ progress over time and put the cut scores in context.
The National Assessment of Educational Progress also uses a vertical scale when comparing states’ scores. Zeiger indicated that California’s new accountability system probably would incorporate that approach.
To get more reports like this one, click here to sign up for EdSource’s no-cost daily email on latest developments in education.
Comments (36)
Comments Policy
We welcome your comments. All comments are moderated for civility, relevance and other considerations. Click here for EdSource's Comments Policy.
navigio 9 years ago9 years ago
I know NAEP state comparisons are of dubious validity, but it's perhaps useful to note that california not only generally performs worse than many other states on NAEP but also appears to perform worse than the average SBAC state. Since I believe the statistics discussed here are a function of the entire group of SBAC states, it should be expected that California's results will be somewhat worse than the predictions made here. There is also … Read More
I know NAEP state comparisons are of dubious validity, but it’s perhaps useful to note that california not only generally performs worse than many other states on NAEP but also appears to perform worse than the average SBAC state. Since I believe the statistics discussed here are a function of the entire group of SBAC states, it should be expected that California’s results will be somewhat worse than the predictions made here.
There is also a difference in NAEP performance between SBAC and non-SBAC states (PARCC or none). How those differences are treated for the desired national comparisons will be interesting.
Replies
Gary Ravani 9 years ago9 years ago
Navigio: A bit of a historical digression and context re the NAEP and CA here. As I recall 1992 was the first year the NAEP scores were presented broken out by state. I attended a meeting at that time with the NAEP people (Sacramento I think) where they explained that they were hesitant to do this, but under political pressure to do so, because they understood that the test was not designed to compare state to state … Read More
Navigio:
A bit of a historical digression and context re the NAEP and CA here.
As I recall 1992 was the first year the NAEP scores were presented broken out by state. I attended a meeting at that time with the NAEP people (Sacramento I think) where they explained that they were hesitant to do this, but under political pressure to do so, because they understood that the test was not designed to compare state to state and that such comparisons would not be “reliable and valid”, but inevitably the press and public were going to do that anyway. The NAEP person appeared to genuinely grieved about that.
Within a few days the scores were published and CA “compared” poorly to other states and sure enough the hue and cry went up about “The Crisis in the Schools!!!” Coincidently, or not, that was a strange time in CA politics when the perennially minority party was in full control of state government holding the governorship and the legislature. (As a result of that “brief time” the public “learned” and they have remained a minority party ever since.)
This whole incident kicked off the “standards and accountability” movement in CA. State tests were mandated quickly followed by standards and “accountability.” Meaning based instruction was out and “back-to-basics” was in because, it must be constuctivism that was the culprit. A law was passed outlawing reading programs that were not phonics based.
This all sounds like it makes some sense except for one thing. The Legislative Analyst’s Office did a report at that time, I think was called The CA Report Card that did analysis of things educational. The head of the LAO at that time issued a report on the NAEP results. The conclusions were that there were really two sets of scores, statically two “J” curves, that showed that schools with students predominately English speaking and middle-class had NAEP scores that matched high scores from anywhere in the nation. Schools with students who were non-native English speakers and poor had some of the lowest scores in the nation. It was only when the scores were aggregated that CA looked bad. Low scores were not a function of teaching methodology, teaching effectiveness, or curriculum they were a function of CA (even then) having relatively high proportions of ESL and poor kids. The LAO report was ignored.
I was on a local radio show debating the then “State Secretary of Education” (a Democrat appointed by a Republican Governor which was interesting) who was calling for stiff sanctions for schools that didn’t perform. I brought up the LAO report that said the main issues were ESL and poverty not school performance. The Secretary said no such report existed. The debate/discussion kind of went downhill from there. The next day I faxed the report to the radio station and they had me on again to talk about it. I don’t believe they received a response from the Secretary’s office. I do not believe the LAO did “Report Cards” much after that.
(Below)
Gary Ravani 9 years ago9 years ago
The API was conceived at about this time. The title of the original task force working on this was "Rewards and Sanctions," a name that ended up being politically unpalatable. So in 1992 we had middle-class students who compared favorably in NAEP scores to other high scoring states, but since that time even those scores have declined. (As far as I know.) This could be attributable to a number of things 1) the test and … Read More
The API was conceived at about this time. The title of the original task force working on this was “Rewards and Sanctions,” a name that ended up being politically unpalatable.
So in 1992 we had middle-class students who compared favorably in NAEP scores to other high scoring states, but since that time even those scores have declined. (As far as I know.) This could be attributable to a number of things 1) the test and standards based accountability systems enacted in the early to mid-1990s were pretty much a flop if NAEP scores are important to you; or, 2) the content standards adopted by CA (labeled “world class” by many-Fordham for example) called for teaching content that is not well covered by NAEP. My guess it’s some combination along with the tremendous growth of the non-native English speaking population in the schools, and that the severe and chronic underfunding of the state’s schools was really beginning to have an exponentially increasing negative impact after per pupil K-12 expenditures dropped below the national average in 1985.
But (!), and there’s always a “but,” there’s this: I have contact with direct representatives of tens of thousands of teachers up and down the state including the two biggest school systems in the state. Most of these folks are classroom teachers themselves. I have asked them if any were aware of their respective districts having students participate in the NAEP. Not one was aware of it. I know that many CA districts were resistant to having students participate in more testing of any kind. I heard “rumors” that the USDE was struggling to get a representative sample of students in CA. I also heard that some districts, in order to qualify for some kind of federal “largesse,” agreed to have some kids take it. I know of no one who knows of students taking the NAEP or any agreements with USDE.
Now it’s possible for kids to be shuffled off without many teachers being aware of it to take these tests. Possible but not probable. Is NAEP getting a true representative sample of CA students to make valid and reliable reports on state performance????
Note: Let me mention here, for those who obsess about various international test scores, that disaggregation of scores shows US school with less than 10% “free and reduced lunch” have the highest scores in the world. School with less than 25% FRL are the equal of any other nation in the world in the international tests. The obvious “school reform” to bring all of our schools into the highest plateaus of test scores is to insure that we have no more than 10% of our kids who live in condition that would qualify them for free and reduced lunch.
navigio 9 years ago9 years ago
Thanks Gary, I totally agree. Even though i've used naep data in the past, i generally qualify it as being suspect. I should have qualified it here even more. In this case, my underlying point was that the sbac numbers are for a bunch of states combined. we may score differently than them, and clearly we had different standards than them, so i think its important to recognize that we should not be surprised … Read More
Thanks Gary, I totally agree. Even though i’ve used naep data in the past, i generally qualify it as being suspect. I should have qualified it here even more. In this case, my underlying point was that the sbac numbers are for a bunch of states combined. we may score differently than them, and clearly we had different standards than them, so i think its important to recognize that we should not be surprised if our eventual ‘results’ end up being different than the sbac predications as a whole. 🙂 perhaps even significantly so. And fwiw, those invalid state comparisons can also be done in a disaggregated manner, which would hopefully limit the invalidity to the representation domain.. 😉 that of course should be enough.. 🙂
Alan Cook 9 years ago9 years ago
National math test scores continue to be disappointing. This poor trend persists in spite of new texts, standardized tests with attached implied threats, or laptops in the class. At some point, maybe we should admit that math, as it is taught currently and in the recent past, seems irrelevant to a large percentage of grade school kids. Why blame a sixth grade student or teacher trapped by meaningless lessons? Teachers are frustrated. … Read More
National math test scores continue to be disappointing. This poor trend persists in spite of new texts, standardized tests with attached implied threats, or laptops in the class. At some point, maybe we should admit that math, as it is taught currently and in the recent past, seems irrelevant to a large percentage of grade school kids.
Why blame a sixth grade student or teacher trapped by meaningless lessons? Teachers are frustrated. Students check out.
The missing element is reality. Instead of insisting that students learn another sixteen formulae, we need to involve them in tangible life projects. And the task must be interesting.
If we really want kids to learn math and to have the lessons be valuable, we need to change the mode of teaching. Our kids can master the math that most adults need. We can’t continue to have class rooms full of math drudges. Instead, we need to change our teaching tactics with real life projects.
Alan Cook
info@thenumberyard.com
http://www.thenumberyard.com
Replies
FloydThursby1941 9 years ago9 years ago
Kids, and parents, are at fault some, significantly. Kids don't study much and immigrant groups prove when you do, you do just fine. Not all subjects are interesting. Kids of strong moral character study hard in every class because they want to be the best. We're not going to be the best in education if kids should only study if teaching is perfect and the subject is interesting. It's great when it … Read More
Kids, and parents, are at fault some, significantly. Kids don’t study much and immigrant groups prove when you do, you do just fine. Not all subjects are interesting. Kids of strong moral character study hard in every class because they want to be the best. We’re not going to be the best in education if kids should only study if teaching is perfect and the subject is interesting. It’s great when it is, but how many hours you study is a test of moral character and diligence. Asians prove it can be done, but it takes a sacrifice most American children, and parents, aren’t willing to give. Expecting it to be all fun and games is part of the problem, not part of the solution. A child has poor moral character who studies only if they have Jaime Escalante as their teacher. A diligent and good kid studies hard no matter what, day in, day out, summers, weekends, whatever it takes it’s the priority. These are the facts, and they are undisputed. If they are disputed, they are disputed by those who are failing in our current system. And those who succeed need to be the ones we lionize and tell our kids to emulate, to strive to be like.
Gary Ravani 9 years ago9 years ago
"If folks really want instructional tests, then my advice is to build only tests for administration during instructional times with no test security conditions, and not to use those tests for measuring the results of instruction." As a "union boss," as well as a classroom teacher, let me go out on a limb here: The true purpose of education is all about the "instructional purposes." And the "folks" who want the instructional tests actually do the … Read More
“If folks really want instructional tests, then my advice is to build only tests for administration during instructional times with no test security conditions, and not to use those tests for measuring the results of instruction.”
As a “union boss,” as well as a classroom teacher, let me go out on a limb here: The true purpose of education is all about the “instructional purposes.”
And the “folks” who want the instructional tests actually do the instructional tests on a regular basis in the classroom. The imposition by the state and the federal government of an accountability agenda has done nothing to further the aims of actual education. It is all about satisfying political agendas and the media. Printing those sports box score type spreads of API “data” proved irresistible. And then came the opportunity to declare a “crisis in the schools!” and point fingers at those who have the least control of the conditions–school funding and social and economic inequities–that created the “test data.”
A good testing system would be something in the order of what’s done in Finland, or what is used by NAEP, a matrix system that reduces time spent on test preparation as well as testing to an absolute minimum and gives educational systems at the district and state level reasonable ideas of how well the system is doing and where general improvement is necessary.
Replies
Doug McRae 9 years ago9 years ago
Gary -- Well, I guess, there comes a time we respectfully have to disagree given our differing perspectives on the issue. Re "all about instructional purposes," I'll agree instruction is the most important purpose but the "all" qualifier reminds me of the 100 percent target for NCLB . . . . setting 100 percent or all conditions is problematic. Data measuring the results of instruction also deserves some time. My personal guideline is that tests to … Read More
Gary — Well, I guess, there comes a time we respectfully have to disagree given our differing perspectives on the issue.
Re “all about instructional purposes,” I’ll agree instruction is the most important purpose but the “all” qualifier reminds me of the 100 percent target for NCLB . . . . setting 100 percent or all conditions is problematic. Data measuring the results of instruction also deserves some time. My personal guideline is that tests to measure the results of instruction (i.e., accountability tests) should take no more than one percent of instructional time, or roughly 9 hours per year. Accountability tests get pushback from the trenches when they take longer, deservedly so.
I’ll agree instructional tests are extremely important for good instruction. Some classroom testing specialists claim good instruction involves 1/3 time doing assessments, for instance good formative assessments (or formative assessment practices) and good interim tests, and I have no reason to argue with that claim. But, my view is these types of tests should be totally under local district / local school / teacher control, rather than part of a statewide assessment system. They should be closely coordinated with other resources to support good instruction, like appropriate instructional materials and quality professional development. They do not need to be closely coordinated with centrally controlled statewide assessments, and in fact when they are close to statewide assessments then the tend to become agents for teaching-to-the-test over time. That circumstance harms good instruction.
Finally, holding up matrix testing as a preferred method for accountability assessments is problematic. It would be OK if the only target is state level data, or perhaps statewide and data for the largest districts in the state. But matrix testing will not yield accountability data for medium or small districts, or at the school level. Folks want accountability tests to apply to all districts and schools in the state (with perhaps the exception of very small units with less than 100 students), and with that feature on the list for accountability tests, matrix tests won’t work. CA has gone through this analysis several times the past 20 years, and each time the answer comes back that matrix testing designs will not comply with what is desired from statewide tests . . . .
navigio 9 years ago9 years ago
I expect that as we de-tooth accountability tests, increased emphasis for accountability purposes will be placed on instructional tests. As long as public opinion remains any kind of driver, I expect there is no way around that, other than avoiding de-toothing in the first place (something that also has it's dangers). I'd love to be able to agree with you that calling out misuse is a solution, but in reality people care more about the … Read More
I expect that as we de-tooth accountability tests, increased emphasis for accountability purposes will be placed on instructional tests. As long as public opinion remains any kind of driver, I expect there is no way around that, other than avoiding de-toothing in the first place (something that also has it’s dangers).
I’d love to be able to agree with you that calling out misuse is a solution, but in reality people care more about the number than they do about understanding what it really means. This is probably one reason we periodically have these accountability ‘resets’ that appear to be designed in a manner that displays growth of any kind.
Doug McRae 9 years ago9 years ago
Navigio — I won’t disagree with your analysis that the public doesn’t understand . . . . I guess I would say this is where a media outlet like EdSource plays a valuable role, an initial outlet for educating publicans who don’t have access to the insider baseball being played with public sector dollars.
Gary Ravani 9 years ago9 years ago
Doug; If there was a chance you were going to be appointed the "testing czar" I'd be inclined to rethink the whole issue of "accountability testing." I respect your intent and analysis. However, that is not likely to happen. I dislike having to repeat the same things over and over as some of the more fevered minds do, but again I point to the National Research Council's assertions that the accountability driven reform movement in vogue since … Read More
Doug;
If there was a chance you were going to be appointed the “testing czar” I’d be inclined to rethink the whole issue of “accountability testing.” I respect your intent and analysis. However, that is not likely to happen.
I dislike having to repeat the same things over and over as some of the more fevered minds do, but again I point to the National Research Council’s assertions that the accountability driven reform movement in vogue since NCLB, and in vogue in CA even longer, have done almost nothing to improve learning in the US.
I would assert that’s because the performance of the schools has not been the cause of poor performance by students, it’s been poor performance of the state (both US and CA) in dealing with conditions of poverty that are really the basis for low measured student achievement.
One consequence of this societal inability (or distraction from) the “poverty man behind the curtain” is that the policy elites, both conservative and liberal, are now faced with either admitting that their proposed “solutions,” testing, accountability, charters, technology, etc., have been abject pedagogic failures or they need to find a scapegoat. We know which way they jumped. Hence, Vergara and other more direct attacks on teachers and teachers’ unions.
Let me repeat something else here one more time: The US has just about the highest rate of childhood poverty in the industrialized world and CA has one of the worst rates for childhood poverty and child homelessness in those same 50 US states. It is foolish to suggest there are not real consequences for allowing those conditions to exist and exist for decades.
Let me complete this statement by quoting from a recent letter sent to the Obama/Duncan USDE from the Advancement Project, Mex-American Legal Defense Fund, the NAACP, the Lawyer’s Committee for Civil Rights, the League of United Latin American American Citizens, the National Opportunity to Learn Campaign, the National Urban League, the NAACP Legal Defense and Educational Fund, the National Council on Educating Black Children, the National Indian Education Association, and the Southeast Asian Resource Action Center:
“The current educational accountability system has become overly focused on narrow measures of success and, in some cases, has discouraged schools from providing a rich curriculum for all students focused on 21st century skills they need to acquire.This particularly impacts under-resourced schools that disproportionally serve low-income and students of color.”
Different take than Vergara, huh? And from people who know.
You have suggested that accountability tests can be used effectively. Cambell’s law says that, as power inevitably corrupts, attaching high stakes to “data” inevitably corrupts the data as well as the system that uses the data. If people with your intentions and integrity were in charge, Doug, perhaps the corruption could be avoided. But people like you are not in charge. More’s the pity.
don 9 years ago9 years ago
That’s right. The people in charge are instead Brown, Torlakson and the ultra-liberal legislature – the people who the unions put in charge and whom you support.
FloydThursby1941 9 years ago9 years ago
Gary, if poverty prevents success why do Asians in poverty do well? Why is Lowell, 41% free and reduced lunch, one of the best high schools in the state statistically? And if you do guarantee no one with kids is in poverty no matter what, could it spiral downward by making those on low wages work less hard, fewer hours? Taxes would have to go so high on the rest of us … Read More
Gary, if poverty prevents success why do Asians in poverty do well? Why is Lowell, 41% free and reduced lunch, one of the best high schools in the state statistically? And if you do guarantee no one with kids is in poverty no matter what, could it spiral downward by making those on low wages work less hard, fewer hours? Taxes would have to go so high on the rest of us it would make many people work less. There is a cost to having zero poverty. You see it in Europe. I’m not saying I wouldn’t trade a lot of things with Europe. but this idea kids in poverty can’t succeed when we are paying billions to pay for school breakfast and school lunch, and no deduction is made to food stamps for the lunches so that is extra calories is beyond me. No one is starving. Kids who say they’re just too poor to do well in school are watching TV, on cell phones, playing games, over 40 hours on average. How do Asians do it? If they do, how is it impossible? Why say we have to solve poverty first? Maybe solving academic laziness would solve poverty, not the other way around.
navigio 9 years ago9 years ago
Doug, I think your last paragraph here is extremely important. This sub-thread has evolved to the question of why we do this in the first place. As you pointed out elsewhere, one reason is so we can measure effectiveness of programs and strategies. But when you say that people want accountability to be applicable down to the school level, is the goal really so that we can evaluate those schools based on their particular strategy … Read More
Doug, I think your last paragraph here is extremely important. This sub-thread has evolved to the question of why we do this in the first place. As you pointed out elsewhere, one reason is so we can measure effectiveness of programs and strategies. But when you say that people want accountability to be applicable down to the school level, is the goal really so that we can evaluate those schools based on their particular strategy of imparting content? Our star results never came with teaching methodology addenda or a link to the district’s curriculum. In fact, few people even knew what was in our standards. Our results largely measure societal influences, and it seems unless there is a concerted effort on the part of test designers, that it may be impossible to distinguish those influences from what we really hope to measure. Of course there have been attempts at this in that we disaggregate scores by ‘circumstance’, but that seems a statistical abstraction more than than a tangible differentiator at the level we’d like it to apply. There is also the similar schools API measure, and perhaps that is getting closer to where we’d like to be but even that has some real problems, not to mention few people seem to take it seriously.
If you think about it, the school site council is one place where decisions could be made to change programs based on results, but from experience, school level summative data seems much too variable to rely on for that purpose. In theory, local BoEs would be another, but they don’t generally get involved in the specifics of instructional methodology, except at the broad level, eg things like project based learning and the like, but even those decisions seem less based on ‘results’, except when the goal is to close a school.
Is there anything we are going to do differently in this round such that such ideals can be realized? Aren’t such distinctions critical for local school and district leaders? And is there some kind of guideline that could be used to inform those leaders so their decisions come from an appropriate context?
IMHO, it even seems that the new process is being designed in such a way as to be applicable even more to staffing questions than the previous one was. Do you think that’s true? And does that come at the expense of program and instructional methodology evaluation?
Doug McRae 9 years ago9 years ago
Navigio -- A few observations on your comment: Re "STAR results didn't come with teaching methodology" -- STAR results were widely analyzed at the local level using local teaching methodology as the context, and that is the appropriate way to include teaching methodology considerations. Re "STAR results measure largely societal influences: -- Yes if view just in terms of overall status, No in terms of improvement data or identifying success stories or pockets for improvement. Re the API … Read More
Navigio — A few observations on your comment:
Re “STAR results didn’t come with teaching methodology” — STAR results were widely analyzed at the local level using local teaching methodology as the context, and that is the appropriate way to include teaching methodology considerations.
Re “STAR results measure largely societal influences: — Yes if view just in terms of overall status, No in terms of improvement data or identifying success stories or pockets for improvement.
Re the API similar schools measure — Comparative analysis against similar schools is a good concept, but it had flawed methodology in its application via APIs over the past ten years, a changing 100 supposedly similar schools from year-to-year that frequently wasn’t a credible similar schools group. I wouldn’t throw out the concept, but I’d recommend a revised methodology.
Re your last sentences about the new process being more applicable to staffing decisions and/or program and instructional evaluations — accountability tests are potentially more applicable to both of those areas than pure instructional tests, mostly due to time of testing (end-of-year) and test security conditions. But we have to be very careful with use for staffing decisions, much moreso at the classroom level than at the entire school level. The fundamental problem is trying to associate any given student score with any given staff member, a problem much more severe at the classroom level than at a whole school level, rather than a problem per se with the tests. I wrote an op-ed on this issue several years ago. A dated quote is right on point for utility of instructional tests for the purposes you cite — in 1953, Henry Dyer said “If you use test exercises as an instrument of teaching, you destroy the usefulness of the test . . . . for measuring the effects of teaching.” That is a powerful statement why tests for instructional purposes do not produce quality data for either staffing decisions or program/instructional evaluations, and why folks want accountability tests for these purposes. Of course, the new process right now in CA’s plan for spring 2015 is neither a well designed instructional testing effort nor a well designed accountability testing effort, so right now all bets are off for good use either for instructional purposes or accountability purposes.
navigio 9 years ago9 years ago
Thanks Doug. I don't know what "STAR results were widely analyzed at the local level using local teaching methodology means. I've seen millions of star results, but have never once seen a statement of how any of those results correlated to a particular teaching methodology in the school or classroom at question. Nor how one methodology compared to another and what impact that should have on a participle set of scores. The closest we get … Read More
Thanks Doug.
I don’t know what “STAR results were widely analyzed at the local level using local teaching methodology means. I’ve seen millions of star results, but have never once seen a statement of how any of those results correlated to a particular teaching methodology in the school or classroom at question. Nor how one methodology compared to another and what impact that should have on a participle set of scores. The closest we get to that seems to be labeling a school as charter or non, or quantifying credential rates and similar, but those are not a specific teaching methodology. As far as I know, ETS doesn’t have access to that information either, so I expect scale score generation does not include those differences. (Please correct me if I’m wrong, that clearly would be useful to know!)
Regarding improvement data vs overall status, point taken. However, that’s only under the assumption we disaggregate appropriately. I have seen many examples of ‘pockets of improvement’ (or decline) that turned out to be unnoticed demographic changes. And given the extent of variability I have seen within individual schools or classrooms, my expectation is that we probably still don’t have our disaggregation properly implemented (surely insufficient to separate out competing characteristics, perhaps missing some altogether). To the extent that is true, even improvement data, particularly on small sets, will be of questionable validity, IMHO of course.
And thanks for the reference to your earlier post. It seems the first of the items you listed has been half implemented, though maybe the caltides portion would be possible via public data, a la latimes (not a statement of validity, just a recognition of an attempt to do this without caltides).
The second has been implemented now with SBAC.
And the lack of the third is probably only a concern for insiders (doesn’t seem to matter for court cases, for example). I have also seen calls for assigning attribution to even district admins, who clearly have zero direct connect time, yet are still seen as partly responsible for the performance of the students. Some of the teacher/staff eval laws even attempt to codify these ‘ratios of responsibility’, some even down to custodial and clerical staff.
I expect to a large extent school and district staff will simply have to live with a measure of inaccuracy or ‘unfairness’ if or when such systems are implemented, just as states and districts now seem more than willing to criticize the validity of the new measures while taking money in exchange for implementing evaluation systems based on those very scores. 🙂
Eppie 9 years ago9 years ago
To learn why CC is not good for our students or our country from a pedagogical view watch this one hour teacher created video.
http://www.youtube.com/watch?v=5w4xD7nzLD8&feature=youtu.be
This is probably the best and most thoroughly researched anti-Common Core presentation to date.
Don 9 years ago9 years ago
I recently read "Report and Recommendations for the Full Implementation of Smarter Balanced Summative Assessments as Required by Education Code Section 60648.5" What struck me was that it made almost no mention of Common Core readiness, only test administration readiness and that it offered no warning as to the limitations of test reporting viability even with full implementation of SB test administration. While different state partners are working in their respective bubbles doing their individual … Read More
I recently read “Report and Recommendations for the Full Implementation of
Smarter Balanced Summative Assessments as Required by
Education Code Section 60648.5”
What struck me was that it made almost no mention of Common Core readiness, only test administration readiness and that it offered no warning as to the limitations of test reporting viability even with full implementation of SB test administration. While different state partners are working in their respective bubbles doing their individual jobs, it is up to the CDE to take all these efforts under advisement and make a determination as to whether the sum total of these individual efforts should equate to a green light for launch on the reporting of assessment results.
Replies
Doug McRae 9 years ago9 years ago
Don -- The state board took up the report you mentioned last Thursday and unanimously voted to go forward with Smarter Balanced tests spring 2015. John had a post on this issue on Friday. During public comment, ACSA recommended the 2015 results not be used for a 2015 Base API as currently anticipated, but the State Board did nothing with that recommendation and it likely will return to the state board agenda for their next … Read More
Don — The state board took up the report you mentioned last Thursday and unanimously voted to go forward with Smarter Balanced tests spring 2015. John had a post on this issue on Friday. During public comment, ACSA recommended the 2015 results not be used for a 2015 Base API as currently anticipated, but the State Board did nothing with that recommendation and it likely will return to the state board agenda for their next meeting in January, also likely to be taken up by the PSAA advisory committee on Dec 2 next month in preparation for consideration by the state board in January. You are right, the report focused on technology readiness for SB tests, with nary a mention of instructional readiness. I had a public comment recommending only selected sections of the entire SB summative assessment system [namely the computer-adaptive only sections grades 3-8] be mandated for administration by local districts and used for accountability purposes, while the remaining portions be available for voluntary administration by locals but not used for any statewide accountability purposes [locals could use those sections for local accountability purposes, if they wish,for instance via LCAPs]. The board treated me just like they treated ACSA, no response, no discussion, just go ahead with plans to administer the entire SBAC summative testing system with all components potentially contributing to accountability calculations. My recommendation was based on the data for technology readiness in the CDE report, as well as whatever can be cobbled together on CA instructional readiness for common core tests . . . . .
Don 9 years ago9 years ago
Doug, you mentioned a lack of critique in the article. I would expand lack of critique statewide. But with so much lack of understanding of these issues (it taxes my understanding) you could call it silence falling on deaf years as concerns the public. That said, the SBE is not the public. Sure the details are very much inside baseball and, as such, not the stuff of print media headlines. However, the reporting … Read More
Doug, you mentioned a lack of critique in the article. I would expand lack of critique statewide. But with so much lack of understanding of these issues (it taxes my understanding) you could call it silence falling on deaf years as concerns the public. That said, the SBE is not the public.
Sure the details are very much inside baseball and, as such, not the stuff of print media headlines. However, the reporting of results are anything but obscure details, affecting virtually every public school family in a very personal manner.
This begs the question: what in your estimation are the forces at play behinds the scenes? When no members of the board voice any concerns regarding issues that you raised, it doesn’t take too much imagination to conclude that they are on board with a political agenda that they intend to steamroll through by hook or by crook.
Without an inside track, I can only guess as to the usual suspect and motivations. But the united front smells of something fishy. Would you be willing to go beyond your criticisms of the SB process and wager to say who, what and why it is that unrehearsed, experimental and vulnerable SB assessment results are being pushed through with a lack of proper professional consideration for the ramifications? Who gains and why?
I can understand if you don’t want to publicly comment in that regard as it could be getting personal.
Doug McRae 9 years ago9 years ago
Don -- Sure, I can respond, but I won't speculate on personal motivations for any of the individual actors on the Sacto leadership stage. The primary underlying influences for statewide tests (all states, for all the years I've been involved) revolve around having tests for purposes of instruction vs having tests to measure the results of instruction. The latter are essentially accountability tests. No single test can serve both purposes well . . . … Read More
Don —
Sure, I can respond, but I won’t speculate on personal motivations for any of the individual actors on the Sacto leadership stage.
The primary underlying influences for statewide tests (all states, for all the years I’ve been involved) revolve around having tests for purposes of instruction vs having tests to measure the results of instruction. The latter are essentially accountability tests. No single test can serve both purposes well . . . . politicians like to claim they support both types of tests, and they promise they will produce tests or testing systems that serve both purposes, but in my 45 years in the K-12 test design and development arena I’ve never seen that holy grail accomplished, and I now say it won’t be accomplished in the next 45 years.
We have the usual suspects supporting each type of testing system. Folks inside the K-12 public school system mostly support tests for instructional purposes [including teachers (especially union positions on testing), and instructional administrative personnel with other administrators having more mixed positions but few fully in favor of strong accountability tests]. Folks outside the K-12 public school system mostly support tests for measuring the results of instruction, or accountability [including parents, policymakers, the business community, the media, and the general public]. Of course, this division is not entirely clean, with some folks in each “camp” having independent opinions.
The forces for tests for instruction are now dominant in Sacramento, a clear change from 10-15 years ago when STAR and the STAR CSTs were installed. The policy positions of the governors [both Wilson and Davis, the divisions are not always partisan] and the SBEs 10-15 years ago were clearly pro-accountability while the SSPIs and CDE staff were clearly pro-instructional testing. The Govs and SBEs had leverage at that time, so STAR was developed as primarily an accountability test, and my contention is it served that purpose well until it was rather abruptly decommissioned after the 2013 testing cycle. The current leadership in the Govs Ofc, SBE, and SSPI/CDE now clearly favor instructional tests rather than accountability tests, so they now have the leverage on the instruction vs accountability fulcrum.
My personal position as a test designer is that end-of-year tests administered under strict test security conditions are de facto tests that will be used to measure the results of instruction, and will have limited use for direct instructional purposes. Thus, end-of-year summative tests should be developed as accountability tests, with valid reliable fair scores being the dominant features, rather than compromised scores masquerading as instructional tests. If folks really want instructional tests, then my advice is to build only tests for administration during instructional times with no test security conditions, and not to use those tests for measuring the results of instruction. MORE
Doug McRae 9 years ago9 years ago
CONTINUED: For the past few years, we see that the PARCC tests have been built favoring the accountability side of the fence while the Smarter Balanced tests tilt toward the instructional side of the fence. The contention over how cut scores are set, i.e., what features are dominant in the cut-score setting process, reflect this division. PARCC chose not to set cut scores on item-tryout data this year and wait for summer/fall 2015 before … Read More
CONTINUED: For the past few years, we see that the PARCC tests have been built favoring the accountability side of the fence while the Smarter Balanced tests tilt toward the instructional side of the fence. The contention over how cut scores are set, i.e., what features are dominant in the cut-score setting process, reflect this division. PARCC chose not to set cut scores on item-tryout data this year and wait for summer/fall 2015 before they set cut scores. That is a decision that favors good accountability data. SB chose to set cut scores based on item-tryout data with a process that featured content considerations rather than the metrics needed for good accountability tests, so they fell on the instructional side of the ledger. Thus, we see the tension over instructional vs accountability tests playing out in this portion of the test development process.
For who gains and why, well, for the immediate future the forces for tests for instruction win a political victory. But its hard to say that victory will result in better instruction, especially if the instructional tests continue to be administered at the end-of-the year under strict test security conditions. So, one view is that the current gambit in Sacramento is really just the forces for instructional tests executing a Trojan Horse strategy to get rid of accountability tests . . . . a public comment I’ve made several times at state board of education meetings. I think it is a legitimate question to ask whether we are really getting good instructional tests, or rather simply getting rid of “evil” accountability tests. In the meantime, while this drama plays out involving hundreds of millions of dollars and a political debate over the underlying purpose for a statewide assessment program, at least in my view CA is not getting good data for either of the contending purposes.
Don 9 years ago9 years ago
Doug, I appreciate the explanation you provided in answer to my question. Unfortunately, I still am not clear on some of the distinctions you make. First of all, can you explain how the "instructional purposes" people benefit by having summative year-end assessments that are neither useful for those purposes nor for accountability either, except in a very cynical way whereby hurried results will lack integrity and , therefore, will be unusable for evaluating … Read More
Doug, I appreciate the explanation you provided in answer to my question. Unfortunately, I still am not clear on some of the distinctions you make.
First of all, can you explain how the “instructional purposes” people benefit by having summative year-end assessments that are neither useful for those purposes nor for accountability either, except in a very cynical way whereby hurried results will lack integrity and , therefore, will be unusable for evaluating students and, more importantly to them, teachers. When you refer to a Trojan Horse, is the idea you are trying to convey that the instructional purposes camp is purposefully watering down the legally required accountability tests (results of instruction) to render them ineffective? I sure hope that such machinations are not happening.
Secondly, how the cut scores play into this tension between the two sides is lost on me. I don’t see how more or less stringent cut scores change the equation that tips the balance and turns what is fundamentally an accountability test into an instructional one. It seems a byzantine game to play on 6 millions students just to rack up some political points for those who would like to undercut tests that might reflect badly on California public education and teachers.
Did I misunderstand you?
Doug McRae 9 years ago9 years ago
Don -- You have understood my distinctions far better than you give yourself credit for. I would not disagree with your summaries for the most part, only provide some tweaks. For your description of the Trojan Horse strategy, I would only clarify that "some" of the folks favoring instructional tests are aware that it also means watering down accountability tests, that others are just pure instructional test advocates not knowing the political machinations involved. On … Read More
Don — You have understood my distinctions far better than you give yourself credit for. I would not disagree with your summaries for the most part, only provide some tweaks. For your description of the Trojan Horse strategy, I would only clarify that “some” of the folks favoring instructional tests are aware that it also means watering down accountability tests, that others are just pure instructional test advocates not knowing the political machinations involved. On the nuances of cut score setting activities, that one is harder to follow. You might want to listen to Joe Willhoft’s presentation to the state board on this issue last Thursday; the webcast archive was posted late yesterday on the state board website, and Joe’s presentation starts about the 1 hr 40 minute mark on the tape, running roughly 40 minutes. Joe very clearly indicated the cut score process involved only content considerations by the panels providing the recommended cut scores . . . . typically for large scale high stakes assessments, cut score panels using a bookmark process consider both content and projection data during the process, but that was not the case for the SB cut score process described by Joe. Instead, projection data was considered only at the policy level, for the chiefs approval. Content only cut score processes are generally used only for instructional tests, not considered robust enough for large scale accountability tests. It was very revealing that the “certifications” from the auditor and two technical advisory groups on Joe’s slides very narrowly provided their opinions based on a “valid content-based achievement level setting process,” i.e., a process acceptable for instructional tests but not for high stakes accountability tests. Yup, a case of the devil is in the details . . . . .
I might reflect on my experiences many years ago with a DC-based lobbyist who worked with large scale assessment issues at the federal level. The lobbyist would frequently tell me “But Doug, remember politics trumps psychometrics every time!” My usual retort was “Yeah, but psychometrics will bite politics in the tail feathers eventually!” Problem is, by the time psychometrics does its biting, politicians are usually termed out . . . . . (grin).
Last, I might reflect a tad on the high stakes involved with statewide tests. Not the more important high stakes involving dissemination of millions of test scores and use of those test scores, but rather the less important dollars portion of high stakes. The feds invested @ $175 million for Smarter Balanced test development over the past four years. One irony is that the feds (i.e., Arne Duncan) favors accountability tests, yet he invested half his Race to the Top Assessment pot of economic recovery dollars in a Smarter Balanced system that essentially undermines the general assessment policies he favors. I have no clue whether that was due to ignorance or some other machination . . . . MORE
Doug McRae 9 years ago9 years ago
CONTINUATION: The dollar story gets more curious when one considers that CA invested an additional $34 million in CA general fund dollars to support the SB 2014 field test, essentially test development dollars (CA didn't get any accountability or instructional use from those dollars). And we are now scheduled to spend @ $60+/- for 2015 SB testing, which with the invalid 2014 cut scores promulgated by SB (done under federal funding) meaning that those … Read More
CONTINUATION: The dollar story gets more curious when one considers that CA invested an additional $34 million in CA general fund dollars to support the SB 2014 field test, essentially test development dollars (CA didn’t get any accountability or instructional use from those dollars). And we are now scheduled to spend @ $60+/- for 2015 SB testing, which with the invalid 2014 cut scores promulgated by SB (done under federal funding) meaning that those cut scores must be redone fall 2015 to get usable valid data from spring 2015 SB test administrations . . . .translates into another $60+/- CA investment in SB test development. So, CA is spending another $100 million to complete the SB test development work promised by SB under federal funding. This isn’t new information for CA officials; I testified to this effect at legislative budget hearings in Sacramento last March, and have made a number of public comments at SBE meetings on these financial issues. So, bottom line is, the SB initiative has cost taxpayers not only $175 million in federal dollars, but another $100 million or so in CA general fund dollars. I spent my career in the private sector, and there are competitive private sector tests to measure the common core — non-profit private sector ACT and College Board have already announced competitive tests, and most likely for-profit organizations like Pearson and McGraw-Hill will also develop competitive tests soon after their contractual obligations for PARCC and SBAC are completed this year. What will private sector agencies be spending to develop competitive offerings? My best former insider guess is they will invest somewhere around $50 million each for test development for common core tests competitive with PARCC and SBAC offerings. The economic differences between public sector consortia developed tests and private sector developed tests for K-12 education are, to say the least, significant . . . . and eventually it will be public school taxpayer dollars that pay the freight.
Don 9 years ago9 years ago
"STATE OFFICIALS WASTE MILLIONS OF SCHOOL TESTING DOLLARS". Doug, how about an article that headline? And the subtitle: "Students Achievement Measures Gamed to Reduce Accountability" Too inflammatory or not inflammatory enough? I have a strategy question that shows my lack of basic understanding. Without the use of projection data for cut scoring, will test results strengthen or weaken? The forces of "instruction only" testing, teachers in the main, would not like the accountability blow back if scores went down, … Read More
“STATE OFFICIALS WASTE MILLIONS OF SCHOOL TESTING DOLLARS”.
Doug, how about an article that headline?
And the subtitle:
“Students Achievement Measures Gamed to Reduce Accountability”
Too inflammatory or not inflammatory enough?
I have a strategy question that shows my lack of basic understanding. Without the use of projection data for cut scoring, will test results strengthen or weaken? The forces of “instruction only” testing, teachers in the main, would not like the accountability blow back if scores went down, especially is they fall precipitously. Does this mean the loss of projection data will augment results for the better?
The misuse of dollars aside, what is the end game here for the policy makers involved if the final result leads to neither a useful instructional test nor a valid results-of-instruction test?
Finally, when Tuck debated Torlakson he lamented the failure to provide parents test results for the item try-out last spring. I assume he was just trying to score political point with the accountability folks and public school parents since no useful results could have been provided. What did you think?
Thanks so much for your reply to my last email. It was absolutely riveting stuff. The best I’ve read on Ed Source, comments or otherwise. All in all, I’d rather it was fiction for the sake of California’s students.
Doug McRae 9 years ago9 years ago
Don -- Let me reply to your "strategy" question (12:36 pm today above) whether the proposed SB cut scores are too high or too low or just about right [to use goldilocks language], based on use or non-use of projection data at various points of the entire process described by Smarter Balanced. Unfortunately, I don't think we have anywhere near enough information to reasonably address that question. The SB standards-setting process was represented as a quasi-scientific … Read More
Don — Let me reply to your “strategy” question (12:36 pm today above) whether the proposed SB cut scores are too high or too low or just about right [to use goldilocks language], based on use or non-use of projection data at various points of the entire process described by Smarter Balanced. Unfortunately, I don’t think we have anywhere near enough information to reasonably address that question.
The SB standards-setting process was represented as a quasi-scientific structured judgment process, and likely it was carried out in a reasonable fashion. But, if bad data is fed into the process, then we have a garbage in, garbage out situation regardless of a credible black box process crunching the numbers (i.e., the bookmark process). Both the item difficulties used for sequencing the booklets used by the panelists and the projections used by the chiefs at the end of the process are very very suspect given their source and timing. The item-tryout design used by SB is not capable of generating comparable item difficulties required by the bookmark process. As my comment dated 10:59 on Nov 18 indicated, we have no idea how the projection data were developed. And spring 2014 was before common core instruction was implemented in 2/3rds of the local districts across the country, per the Ctr Educ Policy report cited by an EdWeek article mid-Oct (the most credible information on status of common core implementation across the country that I have seen).
So, whether the results are too high or too low or just about right is impossible to say, and whether results change due to differing use of projection data is wild speculation at best. We have to wait for good data to feed into the credible black box to generate credible valid cut scores that can be used with a reasonable degree of confidence. We won’t have that good data until summer/fall 2015 at best, after actual SB computer-adaptive tests are administered next spring. That may not be a very satisfying answer right now, but it is what it is . . . . as my recent EdSource commentary indicated, SB tests are still a work in progress, rather than fully operational tests as represented by SB and CA advocates. Not to recognize this reality leads us to using the 2014 SB achievement levels and disseminating more than three million student test scores for California students and schools that have no basis for valid interpretations . . . . that I submit is not a smart thing to do.
navigio 9 years ago9 years ago
Taxpayer dollars always fund public education. And, in the testing realm, there isn't much left that isn't already privately contracted or supplied anyway. It's even arguable that this entire process was driven by private interests in the first place. In that sense, the distinction between public and private sector dollars is arguably an illusion. Anyway, without at least the $60M, there could be no standardized test at all this year (and maybe even without … Read More
Taxpayer dollars always fund public education. And, in the testing realm, there isn’t much left that isn’t already privately contracted or supplied anyway. It’s even arguable that this entire process was driven by private interests in the first place. In that sense, the distinction between public and private sector dollars is arguably an illusion.
Anyway, without at least the $60M, there could be no standardized test at all this year (and maybe even without the $40M). Once you make a decision to move in a direction, I’m not sure how you do that without moving in that direction, setting aside the questions of whether the direction is appropriate and whether any money spent on standardized tests is worth it. 😉
Doug McRae 9 years ago9 years ago
I have to admit -- I don't have a clue how the data for the Smarter Balanced projection charts were developed. The post says the projections were derived from the SB cut scores, but gives no indication how they were developed. The cut scores were set using SB 2014 field test data, but SB's 2014 field test was an item-tryout exercise not capable of yielding data to support valid cut scores . . . … Read More
I have to admit — I don’t have a clue how the data for the Smarter Balanced projection charts were developed. The post says the projections were derived from the SB cut scores, but gives no indication how they were developed. The cut scores were set using SB 2014 field test data, but SB’s 2014 field test was an item-tryout exercise not capable of yielding data to support valid cut scores . . . see my EdSource commentary dated one-day prior to release of SB projections. Nor were the item-tryout data qualified for deriving projections for achievement category percents. Also, per Joe Willhoft’s presentation to the CA state board last Thursday, the projections were not part of the SB panel process for recommending cut scores (as typically would be the case for a robust bookmark process for recommending cut scores). Rather, the projections data only contributed to the vetting information for endorsement by the SB chiefs. Why were the projections held back by SB for the panel recommendation process, but then surfaced for the chiefs’ consideration? More directly, how were the projections developed? And how were the vertical scales (only briefly mentioned in the post, but graphed in the SB presser upon which the post was based) developed? What were the assumptions for these developments, how accurate are the projections (no confidence ranges were included), how credible are they? Lots and lots of unanswered questions about the projection charts.
However, the bigger issue for appropriate use of SB test results for 2015 does not depend on the nitty gritty test development issues just raised. Rather, the big picture is that to yield meaningful data, states cannot initiate statewide tests to measure Common Core instruction before states have substantially implemented Common Core instruction. Until then, any conclusions based on SB results will be invalid, unreliable, and unfair to students, parents, schools, districts, and the general public. California’s plans to use SB tests for timely return of results spring 2015 are based on quicksand if they are based on information released by SB to date. The bottom line is that SB and/or CA have to repeat the standards-setting activities conducted a month ago, and redo the projections and vertical scaling activities, using full SB computer-adaptive data from hopefully a 100 percent census sample, to have valid, reliable, fair results for California’s statewide assessment system. This cannot be done until late summer or fall 2015 at best.
The coolaid being dispensed by SB right now, as dutifully reported by John’s post but without informed critique, just doesn’t make it for timely return of credible statewide assessment data for California spring 2015.
Replies
John Fensterwald 9 years ago9 years ago
It is true, as Doug says, that PARCC is waiting until after results from the 2014-15 actual test to determine cut scores – perhaps the soundest method. And Smarter Balanced and California folks acknowledge that the spring results will be studied to see if changes in achievement level are warranted. What they won’t say is that this evaluation will lead to a revised set of scores next fall, as Doug says will happen.
Paul Muench 9 years ago9 years ago
What is the thinking behind scores from 2000 to 3000?
Replies
Doug McRae 9 years ago9 years ago
Paul -- I understand the thinking was to avoid using a scale metric that folks might confuse with the 3-digit scales typically used for statewide tests to date. Most standardized tests have used 2-digit or 3-digit scales, so SB chose to use a 4-digit scale to avoid confusion with prior scales. In terms of interpretation, etc., there will be no difference between a scale score of (say) 350 or 2350 . . . . in … Read More
Paul — I understand the thinking was to avoid using a scale metric that folks might confuse with the 3-digit scales typically used for statewide tests to date. Most standardized tests have used 2-digit or 3-digit scales, so SB chose to use a 4-digit scale to avoid confusion with prior scales. In terms of interpretation, etc., there will be no difference between a scale score of (say) 350 or 2350 . . . . in other words, the “2” in the thousands place is superfluous and has no meaning other than “don’t confuse me with a STAR scale score” (for CA users). SB could have used a “1” or a “3” or whatever numeral they wanted in the thousands place, woulda made no difference. I guess the “1” and “3” options lost out to the “2” option in the SB governing body pool for choice of scale score metrics (grin).
FloydThursby1941 9 years ago9 years ago
It's to appease extreme liberals. It's like grade inflation. Tests tell more truth than grades due to this. It's designed to make people doing terribly feel they are almost doing as well as those doing well. Let's give everyone a trophy. My kid's graduating, yay, they read at a 7th grade level and won't hold up in college and they watched 40 hours a week TV and played video games and … Read More
It’s to appease extreme liberals. It’s like grade inflation. Tests tell more truth than grades due to this. It’s designed to make people doing terribly feel they are almost doing as well as those doing well. Let’s give everyone a trophy. My kid’s graduating, yay, they read at a 7th grade level and won’t hold up in college and they watched 40 hours a week TV and played video games and rarely opened a book, but they’re graduating, I feel good, let’s celebrate, yay me! It’s like the free 400 SAT Points. We might as well concoct a test that goes up to 100,000 and has a minimum score of 99,000. Total goofball loser kids will get 99,050 and kids who work super hard will get 99,980. Almost the same right? Then when one makes 200k or more and another makes minimum wage, we can say both are middle class. Yay me! Let’s all feel good in the face of disturbing realities. It’s like drugs without the hangover. It’s like a game with one card and you turn it over and it says “you win”. Let’s all feel good regardless of if it is based on something! And by the way, if my kid gets 99,001 and yours get’s 99,999 on the test, it is probably just proof that my kid has more spatio-balance and emotional intelligence and is more well-rounded. Your kid still deserves no praise. He’s being shallow to even mention it.
FloydThursby1941 9 years ago9 years ago
Kumbaya my lord, Kumbaya, oh lord Kumbaya!
navigio 9 years ago9 years ago
So clearly Duncan knew this was going to be the starting point. In that context, is there any possible justification for not completely dismantling the punitive nclb accountability measures? Even the exec dir of sbac admitted students cant do as well now as they will/might in the future. How can this be justified? And why is there no statement here from the feds? Perhaps we need to set a new 100% target starting at, what, 33% … Read More
So clearly Duncan knew this was going to be the starting point. In that context, is there any possible justification for not completely dismantling the punitive nclb accountability measures? Even the exec dir of sbac admitted students cant do as well now as they will/might in the future. How can this be justified? And why is there no statement here from the feds?
Perhaps we need to set a new 100% target starting at, what, 33% or so next year, to 100% by 13 years after that (the time it will take for everyone in the system to have had a full cc-only based education). Though in reality, given that we are no where close to full implementation of cc right now and wont be for at least a few years, we probably should add another 5 or 10 years onto that. So what does that make it, 2035? So we have about 20 years to triple our proficiency rates. Sounds like a plan. Though perhaps we should ask the exec dir whether he even expects 100% to be the eventual target. Maybe there was something wrong with that assumption in the first place. Nah, couldn’t be…
So, 33%, that’s not so good, eh? Public schools are apparently failing. What is to be done?
Replies
FloydThursby1941 9 years ago9 years ago
Students can do well if they work hard and put the time in. The biggest problem is the average kid studies under 6 hours a week and watches over 40 hours a week of TV and video games. Reverse those stats and this is no longer a problem at all. A few bad teachers is a minor problem and should be fixed, should be a priority, but the biggest problem is the … Read More
Students can do well if they work hard and put the time in. The biggest problem is the average kid studies under 6 hours a week and watches over 40 hours a week of TV and video games. Reverse those stats and this is no longer a problem at all. A few bad teachers is a minor problem and should be fixed, should be a priority, but the biggest problem is the desire of kids, what’s in their hearts. Our kids don’t have the same heart as European and Asian kids now. We always like to brag about how hard-working we are but only 36.3% of us showed up to vote earlier this month. Our work ethic is what’s killing us, not high expectations. Certain immigrant groups smash those targets, and it is not too much to expect. You just have to make education a higher priority than amusement.