
 Credit: iStockphoto.com
Statewide student results on the standardized tests measuring knowledge of the Common Core standards were essentially flat in 2016-17, after a year of strong gains.
The California Department of Education released scores for the third year of the Smarter Balanced assessment on Wednesday, about a month behind schedule. The results for all of California’s nearly 1,000 school districts, 11,000 schools and individual student groups can be found and compared on EdSource’s Smarter Balanced database.
About 3.2 million students in grades 3 to 8 and grade 11 took the tests, as required by federal law.
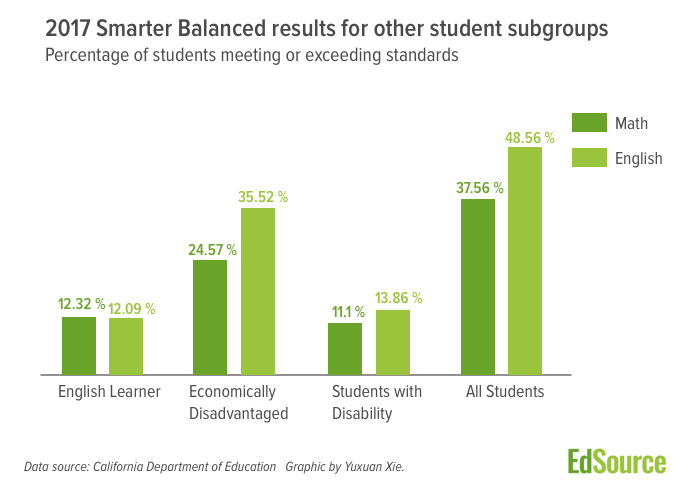
Slightly fewer than half of students — 48.56 percent — tested proficient in English language arts; that was about a half-percentage point drop from last year
In math, 37.56 percent of students were proficient in math, which was about a half-percentage point increase over a year ago. Proficiency is defined as meeting or exceeding standards, the top two of four achievement levels on the Smarter Balanced grading scale.
California State Universities and many community colleges use the results on the 11th grade tests to gauge students’ readiness for college-level work. In 2017, 28 percent of juniors were considered ready and 32 percent were considered conditionally ready with reading, writing and research skills; 13 percent were considered ready and 19 percent conditionally ready in math.
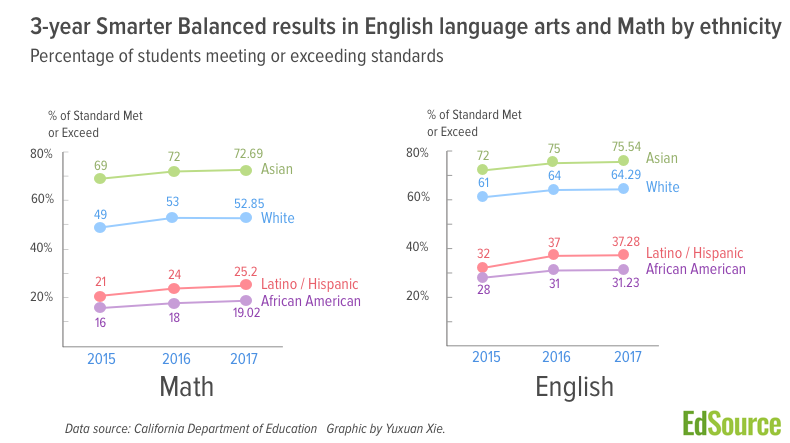
The combination of minor gains and losses put students 4.6 percentage points above 2015, the first year of the test, in both math and English language arts. But flat scores in 2016-17 compared to the year before also meant there was little progress in narrowing a cavernous achievement gap between the lowest and highest performing student groups.
Only 31 percent of African-Americans and 37 percent of Latino students met or exceeded standards for English language arts in 2016-17. That compares with 76 percent of Asian and 64 percent of white students (see chart for full breakdown).
The gap slightly widened for the state’s 1.2 million English learners, with about a 1 percent decline, to 12 percent meeting or exceeding standards in English language arts results. This group contains current English learners only. Once English learners become proficient in English, they are no longer included in this classification.
In a statement, State Superintendent of Public Instruction Tom Torlakson characterized a lack of improvement this year as maintaining progress from the year before. “I’m pleased we retained our gains, but we have much more work to do,” he said.
Others were more critical or said it was too early to judge.
“Math remains a huge issue,” said Arun Ramanathan, executive director of Pivot Learning Partners, a nonprofit organization that works with schools on improvement strategies. “There has been more attention on expanding STEM and computer coding, but if early elementary grade math is languishing, all of the other stuff is meaningless.”
And with scores of English learners lagging so far behind, “we should think about more native language instruction in math; let’s teach them English in English.”
“You should not make big policy judgments based on limited data, and test scores are limited data,” said David Plank, executive director of Policy Analysis for California Education, or PACE. “It would be an error to conclude after three years that academic standards have failed or the Local Control Funding Formula is not accomplishing its purpose” of directing additional resources to the state’s low-income students and English learners, he said.
Ramanathan agreed, saying “blaming LCFF for student performance is a bit of a stretch.” If there is some blame, it’s that the funding formula creates too many priorities to address, he said, “and core academics is not emphasized enough in the current accountability system.”
Looking ahead, Ramanathan said, “we all know funding is going to be tighter, so it will be important to figure out what strategies have worked in the state and where. Right now, we have no information about that.”
Noah Bookman, chief strategy officer for the CORE districts, a partnership of eight districts, said, “At year three, we cannot point to a major policy shift in practice that would result in big gains. Every district has schools where remarkable things are happening but not consistently.”
But some superintendents who did see improvement this year attributed progress to specific actions that their districts took.
“We believe the work we’ve done around early literacy is starting to pay off by 3rd and 4th grade, in terms of comprehension and reading endurance,” said Matt Navo, superintendent of Sanger Unified in the Central Valley, where 90 percent of students are low-income. Reading scores increased 1.5 percentage points to the state average of 48 percent meeting or exceeding standards. Math scores rose 2.5 percentage points to 2 percent above the state average. But 5th grade made remains “conceptually difficult,” he said. Teachers have expressed frustration over the “robust conceptual understanding and reasoning” that is well beyond what’s been asked before. Only 31 percent of 5th-graders met or exceeded standards.
In Long Beach Unified, which increased 3 percentage points in English language arts and 5 percentage points in math, Assistant Superintendent of Research and School Improvement Chris Lund, said, “There is never a simple fix or golden key,” but specific efforts are bringing results. He said these include:
- Deploying coaches, especially in math, who had been tied up with district level trainings, to elementary and middle schools, where they guided teachers in preparing units and sample lesson plans and then observed and modeled teaching them;
- Re-creating regular district tests on the standards, which had been suspended after the adoption of the Common Core;
- Using additional money under the funding formula for after-school interventions and regular use of the computer program STMath.
McKinley Elementary, where about 92 percent students are low-income, and 36 percent are English learners, did all of those and other things, said Principal Scott Tardibuono, and the school raised the percentage of kids meeting or exceeding standards 24 percentage points, from 24 to 48 percent in reading, and 14 percentage points, to 38 percent in math, in 2017.
Tardibuono used money he controls under the funding formula to lower class size in 5th grade the past several years, and students working in small groups developed problem-solving skills in math. But another difference, said Kate Pekar, McKinley’s teacher on special assignment, involved changing students’ mindsets, based on the writings of Stanford University Professor Carol Dweck, to help students believe in themselves and their ability to try harder.
“McKinley had been low-performing school, but we convinced families and students it didn’t have to be that way,” Tardibuono said.
Plank and Bookman noted that the new accountability system had not kicked in to prod districts to improve. But that’s about to change. This year’s test results will be among factors used to determine whether districts and low-performing student groups, such as low-income students and English learners, will receive assistance from the county offices of education.
Before the adoption in 2013 of the Local Control Funding Formula, standardized test scores were the sole gauge of a school’s and district’s performance as measured by the Academic Performance Index. The funding formula established a broader set of measures of school performance, including students’ readiness for college and careers, school climate as measured by suspension rates and student engagement as measured by chronic absenteeism and graduation rates.
Test scores and other performance indicators will be included in the color-coded “dashboard” ratings that the state Department of Education will release in early December. However, the percentage of students who meet or exceed the standards, while easy to explain, won’t be the measure the state will use to determine dashboard performance. It will use the distance on the scoring scale above or below Standard Met. The state has not yet made that calculation.
Plank acknowledged that by year three of testing, the time has come to see positive results, but “the missing piece is additional support from the state to help local educators.” Mastering the new standards will take time and require patience, he said. To abandon that effort “is to pretend that we know what is going to work to accelerate improvement for kids who need it most. And we don’t.”
Test issues?
English language arts scores in all of the other 13 states administering the Smarter Balanced tests also experienced a decline in the percentage of proficiency, ranging from 0.6 percent to 2.3 percent. For math, there were both gains and declines among those states (see state by state breakdowns).
Edward Haertel, professor emeritus at the Stanford Graduate School of Education and a specialist in assessment, wrote in an email that uniform declines are unusual and raise questions about the test itself.
“The fact that 14 out of 14 states show changes in the same direction pretty much confirms that these are not merely chance fluctuations. The obvious question that arises is whether there’s some reason the numbers for this year versus last year are noncomparable,” he said. “It’s possible there was in fact some slight overall decline in students’ proficiency and the test results are accurate, but as a psychometrician, I’d want to work hard at eliminating rival hypotheses before settling on that conclusion.”
Tony Alpert, executive director of the states-run Smarter Balanced Assessment Consortium, said in response, “There is no reason to believe there was anything wrong with the administration of the test. We are still getting data from states and will do a rigorous review of the data.” There was a big gain in scores last year, he said, and no substantial loss of ground this year. “We have every reason to believe data represent what students know and did.”
To get more reports like this one, click here to sign up for EdSource’s no-cost daily email on latest developments in education.
Comments (11)
Comments Policy
We welcome your comments. All comments are moderated for civility, relevance and other considerations. Click here for EdSource's Comments Policy.
Marvilene Hagopian 6 years ago6 years ago
Consider this bit of history provided by Jim Milgram: “Here in California, Ze'ev Wurman's work shows that the 12 years of reasonable standards and state enforcement actually did reduce the achievement gap and in the right way. Scores for "minority" groups went up significantly, while scores for others were roughly unchanged. As you know, I was on the Common Core Validation Committee, so I had a first row seat to what was happening. You should … Read More
Consider this bit of history provided by Jim Milgram:
“Here in California, Ze’ev Wurman’s work shows that the 12 years of reasonable standards and state enforcement actually did reduce the achievement gap and in the right way. Scores for “minority” groups went up significantly, while scores for others were roughly unchanged.
As you know, I was on the Common Core Validation Committee, so I had a first row seat to what was happening. You should have seen the sudden increase among the math educators involved – when Ze’ev’s results first appeared – in their desire to get rid of the CA standards.
I had a long argument with the most well known among them. I focused on explaining our results in eighth grade algebra which had shown a very high percentage of those minority kids passing the course and scoring pretty well on the state exam.
The more they understood what was going on, the more determined they became. I recall that when I mentioned that fully 2/3 of the California students were taking eighth grade algebra, one of them said that’s horrible, and the others agreed. That’s when I realized I wasn’t speaking the same language they were, I had to get out, and I finally felt I had to report to Governor Schwarzenegger’s office that California should not get involved with Common Core. Unfortunately, the Race to the Top money had already been announced, and California was desperate for funds. So it was too late. He tried to keep eighth grade algebra, but it only took Jerry Brown and Mike Kirst one or two years to get rid of it.”
Not long ago California was on the right track; it was so unsettling to see how quickly and easily that progress was derailed.
Gail Monohon 6 years ago6 years ago
This article states that “there was little progress in narrowing a cavernous achievement gap between the lowest and highest performing student groups” since Smarter Balanced testing began, and the question is “Why?” Since “nothing changes if nothing changes,” and ineffective change results in worsening of outcomes, then it is obvious that either nothing significant has really changed in classrooms or else the changes that have been made were ineffective – Band-Aids instead of major surgery. LCAPs give … Read More
This article states that “there was little progress in narrowing a cavernous achievement gap between the lowest and highest performing student groups” since Smarter Balanced testing began, and the question is “Why?”
Since “nothing changes if nothing changes,” and ineffective change results in worsening of outcomes, then it is obvious that either nothing significant has really changed in classrooms or else the changes that have been made were ineffective – Band-Aids instead of major surgery.
LCAPs give some idea of what is transpiring in schools, but probably are misleading in many cases, since the name of the game is often “Write It Down If It Makes Us Look Good.” Lip service is given to highly recommended programs whether or not they have actually been implemented with fidelity (e.g. restorative discipline), and stakeholder engagement is measured in numbers of parents attending open houses, not parents/teachers at the decision-making table. Similarly deceptive, adoption of new instructional materials/programs is documented with no indication of the actual quality of classroom instruction by fully competent staff.
What we do know is that test scores of Asian and White students far surpass those of Latino/Hispanic and African American students. We have clearly not learned how to change this – or else we have not chosen to make changes that would reduce the gap. It is always easier to just keep on doing what we are accustomed to doing – behaving as bureaucratic institutions.
Replies
Marvilene Hagopian 6 years ago6 years ago
Between 2000 and 2005, California was on the right track and showing unprecedented gains in student achievement especially in low-income, high-poverty schools. Our standards were second to none, and we adopted two excellent reading programs for K-6 students. President Bush’s Reading First was modeled after curriculum frameworks and training programs based upon current and confirmed research developed here in California by administrators, coaches and teachers who knew how to teach reading. Low-income, high English language … Read More
Between 2000 and 2005, California was on the right track and showing unprecedented gains in student achievement especially in low-income, high-poverty schools. Our standards were second to none, and we adopted two excellent reading programs for K-6 students. President Bush’s Reading First was modeled after curriculum frameworks and training programs based upon current and confirmed research developed here in California by administrators, coaches and teachers who knew how to teach reading.
Low-income, high English language learner populated schools who followed our lead improved overall student test scores from below the 20th percentile to the 80th percentile. The Latino Caucasus was swayed by the other side, claiming the gap was not closing fast enough. Why no one failed to acknowledge the astounding rise in student performance for all is beyond me. So, the curriculum and standards reverted back to methods that haven’t worked and never will. To learn more read, Ed Hirsch’s “The Schools We Need and Why We Don’t Have Them.”
el 6 years ago6 years ago
The statistics of all these numbers should be handled with some care. Remember that the way these numbers are handled is that a raw score for each student is generated, then the scores are divided into four categories based on the distribution of the raw scores, and then we are reporting the percentage of scores in each bucket. So for example: Reading scores increased 1.5 percentage points to the state average of 48 percent meeting or … Read More
The statistics of all these numbers should be handled with some care.
Remember that the way these numbers are handled is that a raw score for each student is generated, then the scores are divided into four categories based on the distribution of the raw scores, and then we are reporting the percentage of scores in each bucket.
So for example:
Doesn’t quite mean what it implies. That is, for example, raw scores in total for students could be either up or down. 1.5% more students got into bucket 3 or 4. But, it could also be that fewer are in bucket 4, that many went from bucket 2 to 1, and that students had higher or lower scores within the buckets. Also hidden in that statistic could be a big positive change that nevertheless didn’t move many students across the bright line cutting off bucket 2 and beginning bucket 3. If the same number of students score in bucket 2 we call that the same result even if thousands of students went from the bottom of bucket 2 to the top of bucket 2. Some schools that might have similar percentages in each bucket may have much harder lifts than others.
These scores are very blunt instruments. They’re interesting and useful but I hope we tread with care before making huge pivots in policy on generalized reports. We’ve made significant changes in curriculum k-12 and that foundational work, plus the work to transition from one standard to the new, does take some time.
Students themselves also change year to year, as do the external pressures on them.
Replies
John Fensterwald 6 years ago6 years ago
You’re right, el. The emphasis for the dashboard is the growth in the average scale score, not the percentage of students who jumped an arbitrary line into Level 3, the Met Standards band. The dashboard will give credit to schools that increased their scale scores substantially but still did not make Level 3.
Don 6 years ago6 years ago
El, I couldn't agree more with your comment. Speaking of huge pivots in policy, here in San Francisco, the district made one of the biggest policy shifts possible. It eliminated tracking concurrently with implementing Common Core and also dispensed with math textbooks in favor of proprietary instructional materials. As you know we have the largest achievement gap of any urban district in California and our African and Latino students have historically underperformed those in Los … Read More
El, I couldn’t agree more with your comment. Speaking of huge pivots in policy, here in San Francisco, the district made one of the biggest policy shifts possible. It eliminated tracking concurrently with implementing Common Core and also dispensed with math textbooks in favor of proprietary instructional materials.
As you know we have the largest achievement gap of any urban district in California and our African and Latino students have historically underperformed those in Los Angeles Unified. The latest SBAC results have African-American students performing worse than in 2015 with the Not Met category increasing. Your analysis notwithstanding, the results give a very unbecoming snapshot of an ominous trajectory.
Don 6 years ago6 years ago
It's hard to stomach Torlakson's spin. No gains are good because at least we didn't lose ground from last year? Nice work when you can get it. I'd like to remind the SSPI that not advancing is not good and nothing to brag about. Standing still is not a victory for advancing student achievement. They should call the response in Sacramento "What Happened 2" Read More
It’s hard to stomach Torlakson’s spin. No gains are good because at least we didn’t lose ground from last year? Nice work when you can get it. I’d like to remind the SSPI that not advancing is not good and nothing to brag about. Standing still is not a victory for advancing student achievement. They should call the response in Sacramento “What Happened 2”
CarolineSF 6 years ago6 years ago
What if tests were used only to assess what kind of help and support kids needed, so that help and support could be provided? What if that were universally viewed as the only acceptable purpose for testing? What if education journalists covered testing with that in mind? Oh, just silly fantasies…
Replies
Don 6 years ago6 years ago
Caroline, testing is part of government accountability on the part of school districts which receive almost half of all the money collected from the people of this state. If you believe in equity, you need to know how students are doing comparatively.
Doug McRae 6 years ago6 years ago
John: Your link to my data document on Consortia 2017 State-by-State Comparisons in the Test Issues? section of the post was edited to eliminate one page of data and two pages of observations on the consortia-wide data. Please change your link or post the full document here . . . . The full document provides another paragraph on page 1 as well as further numeric analysis on page 7 and material on pages 8 and … Read More
John: Your link to my data document on Consortia 2017 State-by-State Comparisons in the Test Issues? section of the post was edited to eliminate one page of data and two pages of observations on the consortia-wide data. Please change your link or post the full document here . . . . The full document provides another paragraph on page 1 as well as further numeric analysis on page 7 and material on pages 8 and 9 that guides interpretation of the 2017 consortia-wide results. Doug
Replies
John Fensterwald 6 years ago6 years ago
Here is the link to the full document, Doug.